Behavior of Heterodera schachtii populations at changing temperatures

The impact of varying temperatures between 1973-1993 and 2011-14* on the population dynamics of Heterodera schachtii
The application of the Leslie model on data from 2011 to 2014 (Site Elsdorf, Rhineland, 50°56'21N,6°33'48E) as a tool for
the analysis of hyperspectral reflectance data had additionally shown how a) yearly accumulated temperatures (degree
days, base 8°C, DD8) have increased compared the temperature records, the model has been calibrated to (1971-1992) and b)
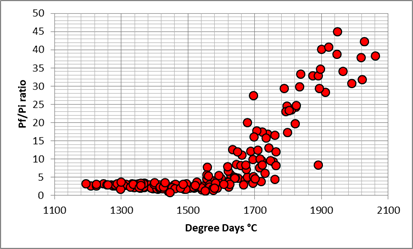
the multiplication rates of H. schachtii have increased disproportionately high, similar to the population dynamics,
which occurred rarely in earlier times, for example in 1983.
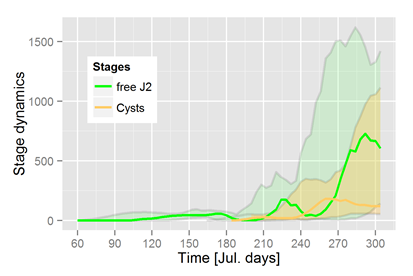
The introduced Leslie model combined with the integrated sugar beet model has been developed and calibrated
in relation to the temperature data from 1973 to 1993. On average the following scenarios have been
established for both the host (fig. 1a) and the nematode (fig. 1b), as usual, including the variation of the
95% quantile. The system varies significantly over time as well as over density.
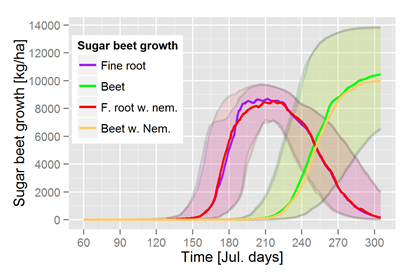
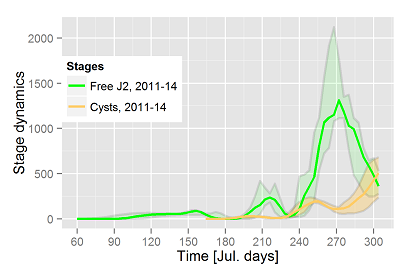
Nematode related losses are small on average (median), but the variation over time as well as the yield structures of both model components are high due to the temperature variance of 1973 - 1993. Adding the dynamics due to the temperature patterns from 2011 to 2014 results in the following chart:
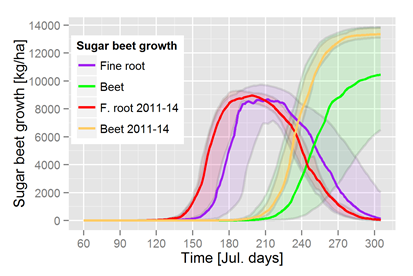
Two phenomenon are observable in a direct comparison: both sugar beet and nematode are shifted on the time axis, the whole system is accelerated. But the trajectories observed for today have been observed in earlier times as well, as the new data are part of the confidence intervals. The current trajectories are all at the upper quantile (~limit?), while this has been a rare event from 1973 to 1993. The acceleration of all development processes is in the range of 2 to 3 weeks. The (simulated) beet yields are in the upper quantile (fig 2.a), yields, which match the observations of the plots within the four years. Most interesting, the plus in yield is temperature related and not a breeding result.
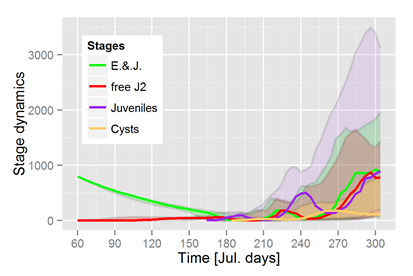
A better overview about the temperature related differences is given by a focus on some of the more relevant stages of H. schachtii (fig 3 a, b). Both J2 and cysts have an earlier appearance rate and end up in much higher densities (fig. 3 a, b)
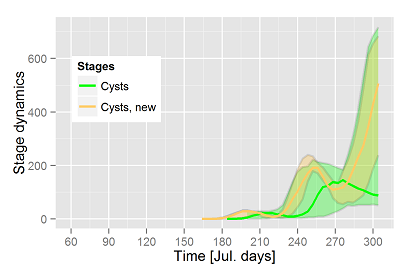
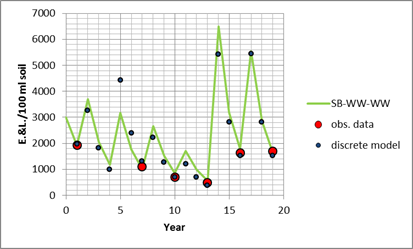
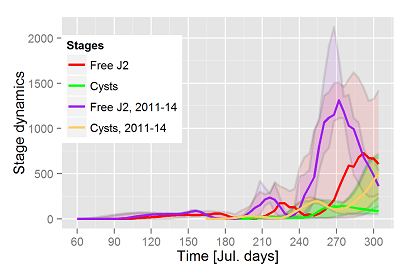
The differences become even more clearer by just stressing on the cysts dynamics from 2011 on. When the model system had been developed and calibrated, the simulated cysts at end of the sugar beet season build up the initial population of the next season. Applying common death rates under non hosts of a crop rotation ended up in reasonable estimators of Pi values at the next planting sugar beets (fig. 5). The direct comparison of the cysts dynamics highlights the difference of both periods. The cysts dynamics in autumn stagnate on average in the earlier period (green line, fig. 4), while now, caused by faster temperature controlled development rates of the cysts (and probably a larger host capacity for H. schachtii), the cyst population increases drastically in autumn (yellow line, fig. 4). As seen by the (green) shaped area, such dynamics has happened in the early period as well. 1983 is an example year, relates to year "13" in fig. 5. 1983 is characterized by high temperatures (and degree days above 1700 °C) and a massive multiplication of the nematode population. The Pi value at next planting sugar beets is high above threshold level again, (not only the simulation result, but also the observation data (year 16, fig. 5). The population increase from 2011 to 2014, similar to 1983, means Pf values at about 10000 E&J/100 ml soil. Such values have been found occasionally in the plots of experimental site, but has not been recorded for praxis fields. The next concern: the maximum of cysts development is not reached yet, even higher populations are likely.
The topic of this page has initially not been part of the Heterodera schachtii project. It has shown up by chance as a side effect of analyzing the possibilities of population density estimation by hyperspectral reflectance data.

