Modeling and density estimation of Heterodera schachtii populations
Temperature related features of the host-parasite interaction of the sugar beet / BCN system
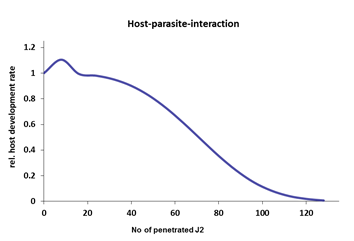
During model development the following feedback conditions have been established to specify the characteristic density dependency of H. schachtii dynamics (fig. 1). The focus of this chapter is the behavior of the host responding the nematode penetration. Low densities increase the development of the host (fig. 1), followed by a density range of tolerance, some type of capacity term, again followed by a density range, when root growth is retarded until to a complete stop. The nematode is self limiting in this range. The function of fig. 1 links the Leslie model with the difference equation system of the root, which in turn controls the transition probability of the Leslie model. The climate chamber experiments have shown that the assumptions made during model development are not that static as shown in fig. 1. In fact the capacity term is variable with temperature and crop age, i.e. which size of the root system exists over time. Fig. 2 presents the conditions for all temperature levels, the capacity term of the host changes with respect to H. schachtii in a classical hyperbolical way. The trajectories vary with temperature.
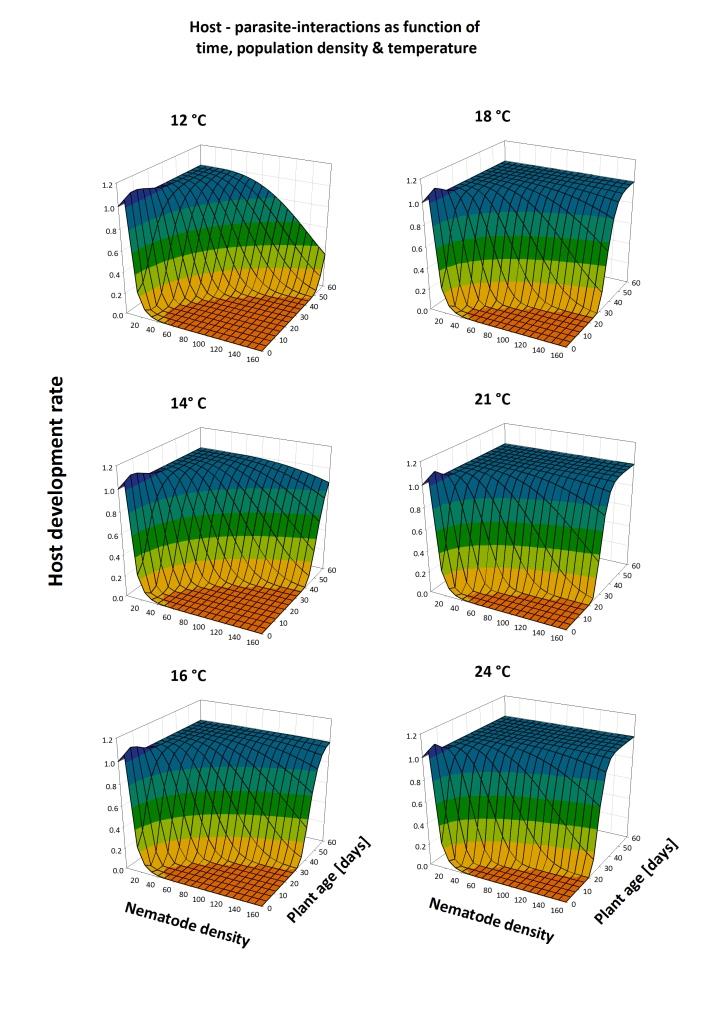
increasing plant age, max. growth depression in the orange area
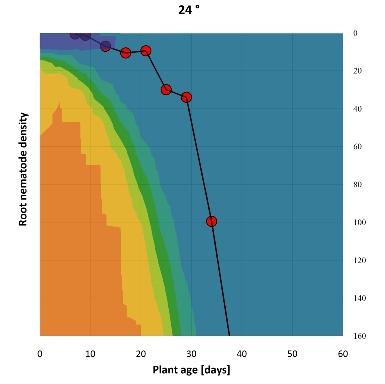
Fig. 2 visualises the tolerance level of the sugar beet as function of the temperature, nematodes in the root and crop age as the result of the climate chamber experiments. The capacity or tolerance range is defined as the area of nearly full root growth rates (blue area). The orange area with rates of 0.2 down to nil means zero growth. The transition is narrow as demonstrated by the depicted slopes. The areas of interest are the very low and high population densities. The juveniles plants have a capacity of approx. 10 juveniles, exceeding the critical density stops the root growth instantly, independent of temperature. 20 days old seedlings tolerate 20 juveniles at 12°C, 40 at 21°C and 50 juveniles at 24°C. To achieve a tolerance level of 160 juveniles requires more than 60 days, a small increase from 12 to 14°C reduces the time to 60 days. At optimal temperatures of 24°C the crop needs 25 days only to grow up to a critical size for tolerating that amount of juveniles. The demonstration does not stress the absolute numbers of juveniles, they could be even larger in other experiments, but for the internal relation of capacity and temperature, as was found in this specific climate chamber experiments. As larger the asynchronism of the sugar beet - nematode system as a function of temperature are as more different are the results.
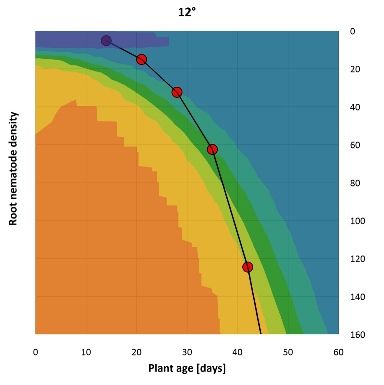
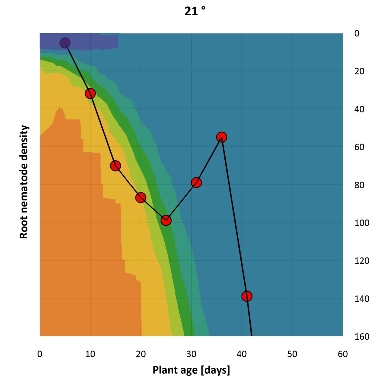
Three stable conditions are characterizing the underlying principles. For a better illustration the time courses of the juvenile development (red dots) are plotted against the development rates of the hosts (fig. 3, the colors demonstrate the rates): At 12°C illustrates the more classical relations, which present more or less the field situations. Root development is a little bit more accelerated compared to the hatching rates of J2. The juvenile crop can tolerate the penetrated J2, but after a critical density the juveniles overwhelm the root capacity. The crop is not able to maintain the original growth rates (fig. 3a). The root system stagnates nearly at once at 21°C, the free J2 do not find any penetration points, the population collapse. The host is refreshing in parts, the growth rates return to nearly full rates (but the crop is already strongly damaged and stays smaller), eventually following J2 might have the chance for penetration, until the J2 overrun the root again (fig. 3b).
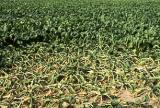
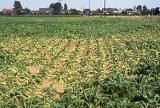
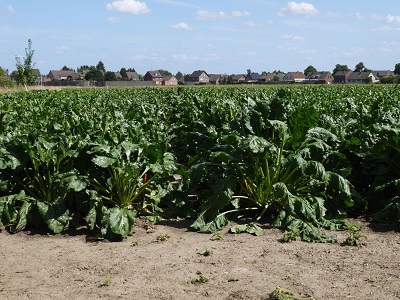
A third and eventually most important phenomenon occurs at 24°C. The root system develops faster than the J2 hatching rate. The crop tolerates high juvenile numbers in the time frame of observation (fig. 3c). It looks like as if the root grows simply away, contemporary no limitations occur for the nematodes, a sufficient nutrient and energy supply is provided. The nematode can use its complete multiplication potential. As a result plenty of nematode in the root and contemporarily none or just tiny depressions in the canopy growth. Exactly this situation have had happend in the last years (fig. 4). The canopies are fully developed despite high population densities of H. schachtii, the wilting clusters occur just occasionally. Those years correspond in total with high Degree Days.

