Density estimation of Heterodera schachtii populations with hyperspectral sensors; Chapter: General linear modeling


Extension: The General Linear Modeling procedure is one of several possibilities to determine continuous or quantitative variables by hyperspectral signatures. With respect to the objectives of this project the quantitative data E&J/100 ml soil, "EuL"). The combination of the parameters of the Weibull model and the GLM procedure results in:

The target EuL (or any other target) is the sum of products of the non-linear Parameter of the Weibull model fitted to the hyperspectral signature (Wi) times a related linear variable Xi plus a constant C.
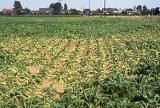
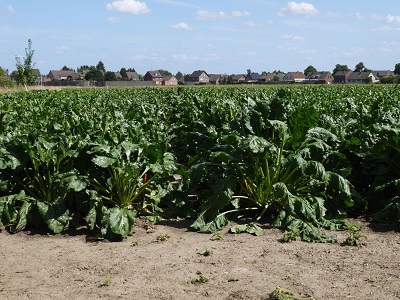
Using the three sugar beet varieties as an example (Beretta, susceptible; Nemata, resistant; Theresa, tolerant) results in a common model fitted to the field data, which allows conclusion about the density of the sub soil population of H. schachtii based on the hyperspectral information.
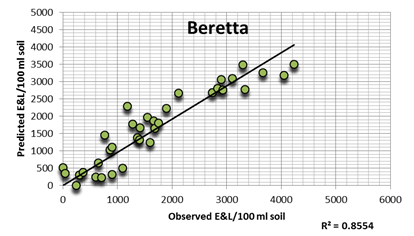
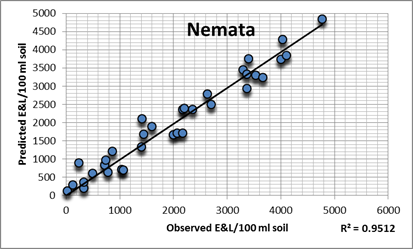
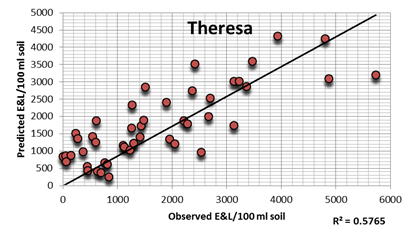
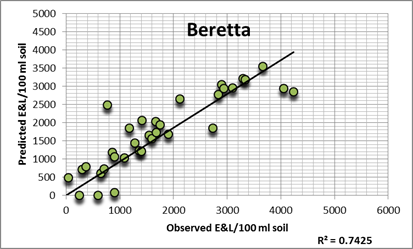
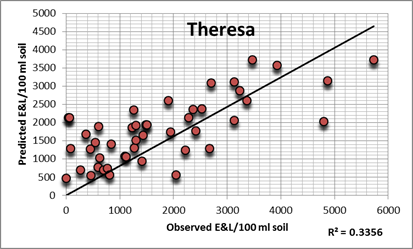
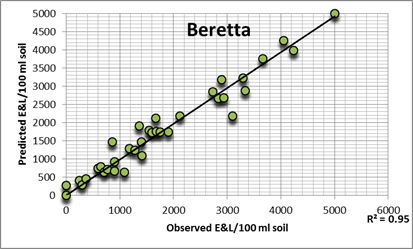
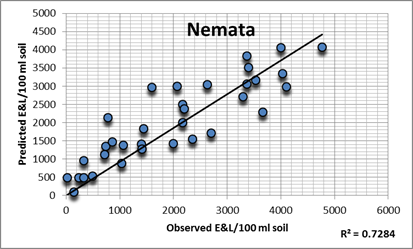
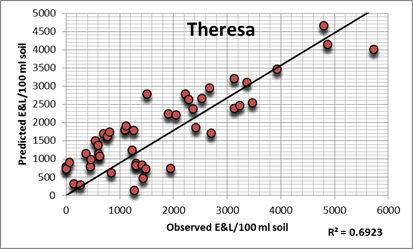
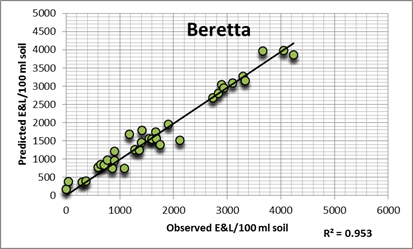
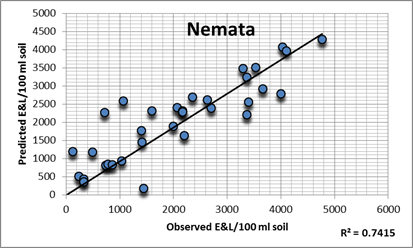
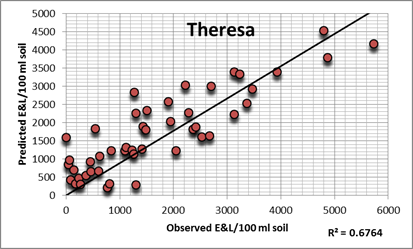
Although correlations are high and no systematic deviance of the 1:1 line occur, this is an empirical feasibility study only. First, the GLM model is not stable, i.e. the estimated parameters as well as the precision of the parameters vary over time. Two reason for this findings might be explained by the description of the underlying situation: the nematode densities data were taken from soil samples before planting sugar beets. Spectra haven been taken some time later during season, while both the host and the nematode interacting in a complex way and development has been controlled by all seasonal factors. Secondly, the plots in 2013 and 2014 have had half size of 2012, hence not enough data (= plots) per variety have been available for solving the regression problem. The classical p>q problem, p is the number of required parameters to estimate, q the number of data. Just the design of 2012 provided a sufficient data set for the statistics. Nevertheless, we have been able to attend such an exiting experiment.

