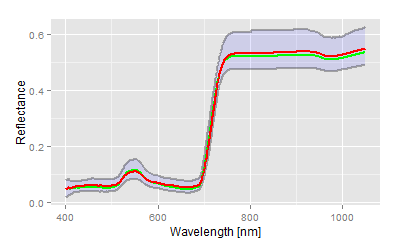
Smart analysis of hyperspectral reflectance data in research, development and practice.

We have developed smart statistical tools to manage and analyse spectral reflectance data to identify and characterise even minor treatment effects. These tools are available as a service for your personal needs, anonymous and on time1.
Exploit our innovative approach to ensure your business success.
Who are the potential users of this analysis technique? All those in industry and research, who undertake lab, greenhouse or field experiments that use non-invasive, unbiased measurements and require quick but rigorous result. The Nemaplot approach can be applied to high-throughput devices in the lab, to image analysis of field sites and is also relevant to all who perform active canopy management and precision farming.
The addition of spectrometer measurements to your protocols provides fast, non-destructive ways of gathering data? At Nemaplot we do the analysis for you ensuring full interpretation in timely manner.
Do you control and manage your experiments under real time conditions!
Are you still doing extensive field trials including harvesting campaigns concluded by intensive lab analytics to test your ideas, new techniques, methods or products?
Do you still wait months for your (statistical) results.
Is the answer simply often "Yes" (there is a treatment effect) or "No"?. Spectroscopy might not replace classical analytical protocols completely, but if your treatment affects the leaf (as most treatments or traits do) it helps manage your experiments from an early stage. It enables the early gathering information on the impact of treatments or traits in a direct and repeatable manner. The use of optical properties is not limited for crops, but can be used for any other object which reflects light.
For a more detailed explanation of the potential benefits of our services see our recent case studies below. Beside the common basics we introduce the innovative analysis method of the Nemaplot project, ranging from a simple mean comparison case up to more complex and advances experimental designs and the specific analysis. Nemaplot developed a collection of procedures adapted to your personal demands and abilities of analysis.
1The analysis process requires the individual check of conditions and initial values, therefore an automatically analysis is not applicable for the time being.
 Evaluation reinvented
