Price list and services in hyperspectral data evaluation
The size of analysis might be individually designed to your purposes. Orders are made with respect to your own analysis facilities.
Price list valid from August 2017, all prices are in Euro including VAT.
The patented model fitting is the mandatory base for the analysis. The fee is proportional to the required computing time per spectrum.
Model fitting for standard model "green plant tissue" per day of experiment:
1without atmospheric band correction above 1300 nm.
- Fee per spectrum (< 1000 spectra)
- up to 900 nm: 0.06 EUR
- up to 1300 nm: 0.08 EUR
- up to 1700 nm1: 0.15 EUR
- up to 2500 nm1: 0.17 EUR
- Fee per spectrum (1001-2000 Spectra)
- up to 900 nm: 0.05 EUR
- up to 1300 nm: 0.07 EUR
- up to 1700 nm1: 0.12 EUR
- up to 2500 nm1: 0.14 EUR
- Fee per spectrum (2001-4000 Spectra)
- up to 900 nm: 0.02 EUR
- up to 1300 nm: 0.04 EUR
- up to 1700 nm1: 0.10 EUR
- up to 2500 nm1: 0.12 EUR
1without atmospheric band correction above 1300 nm.
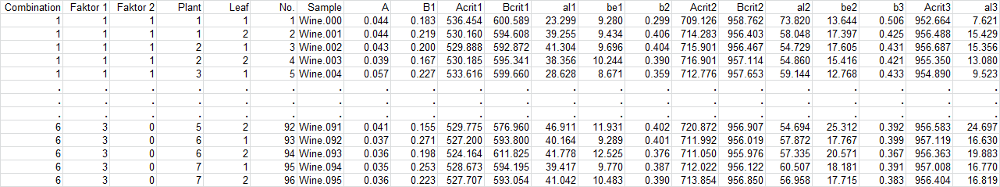
You receive a CSV or Excelfile including the parameter estimates corresponding to your chosen indexes. The estimated parameter provide all the information needed to perform the analysis introduced here for yourself (discriminant analysis, calculation of canonical distances, but also other multi-variate procedures as cluster analysis). The multi-variate procedures seek for differences among all parameters simultaneously.
Example file
Add-ons and additional fees incl. VAT
| Services/products | EUR |
| Basic package: fitted spectra (5 nm steps) as Excel File, if your spectra need to be smoothed only | 0,- |
| Discriminant analysis for a simple mean comparison, Word file containing the most important statistical parameter, discriminant scores will be added to the output file, no interpretation. | +10,- |
| + plus figures of the mean spectra and 95% confidence intervals (format png, data in Excel), allows a visual comparison, frequency distribution of the scores, canonical distance, short interpretation with respect to the significance of the parameters for given experimental design (requires discriminant analysis first). | +20,- |
| Discriminant analysis of a single factor experiment, Word file containing the most important statistical parameter, discriminant scores will be added to the output file, no interpretation. | +10,- |
| + plus discriminant analysis (mean comparison) of each factor level against the control, incl. canonical distances and frequencies, fee per comparison. | +5,- |
| + plus figures of the mean spectra and 95% confidence intervals (format png, data in Excel), scatter distribution of the scores, canonical distance, short interpretation with respect to the significance of the parameters for given experimental design (requires discriminant analysis first) | +30,- |
| Discriminant analysis of a double factor experiment: Mean comparison of the combination of all factor levels, Word file containing the most important statistical parameter, discriminant scores will be added to the output file, no interpretation. | +20,- |
| + plus discriminant analsyis (mean comparison) of each factor level combination, incl. canonical distances and frequencies, fee per comparison. | +10,- |
| Plus figures of the mean spectra and 95% confidence intervals (format png, data in Excel), frequency distribution of the scores, canonical distance, short interpretation with respect to the significance of the parameters for given experimental design (requires related discriminant analysis first) | +50,- |
| Multi factorial experiments: As the number of potential combination increases drastically we recommend a personal consultancy about the choices of combinations. | on request |
| Analysis of time series experiment: see packages and fees above per day, more than two days, minus 25% | |
| Removal of atmospheric water domains, open air spectra up to 2500 nm require a correction procedure in the related bands of the short wave infrared domains. What will be done? Additional costs per spectrum | +0.02,- |

