Data processing
It is part of the customer to make his hyperspectral data anonymous and process the data for analysis. It is important to maintain a comprehensible structure to address each measurement/spectrum of indexes by factors, factor levels and repetition. The use of indexes contemporary make your data anonymous. Whatever the scientific background of your spectral data might be, for example new varieties or pesticide, the signature data are treated as indexed factors with related levels only. The access and true information remains in your hand.Important!
Please send your prepared data sets as ASCII files as *.csv format (";" delimiter) or as Excel file. We are not aware about all data formats of available sensors.
The computer time requirement depends on the wavelength range you use. Eventually we must omit the ranges of atmospheric water bands. We kindly ask our customer to decide beforehand which domains might be of specific interest and which can be excluded from analysis. Information below 400 nm is principally excluded. Should your sensor range up to 2500 nm, two concerns have to be considered: 1st sample size should be three times larger than for 1000 nm sensors and secondly open land measurements include atmospheric water bands, which have been linearised, but must not be considered in the analysis. Please follow the link for a more detailed explanation of the water absorption bands.The software of your sensor should support the export of ASCII files. All reflectance measurements are combined in columns of a table (see example). Please maintain the correct order in all steps as we are not able to check or to correct anonym data.
We recommend the following data structure and index distribution for a two factorial experiment:
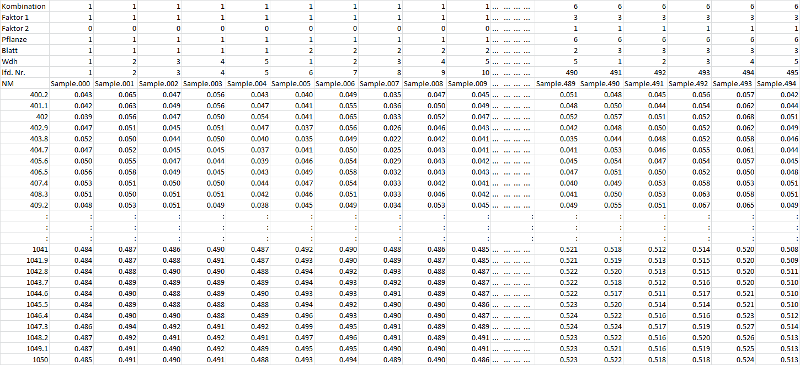
The first column contains the used wavelength intervals of the sensor, the following columns contain the measurement of the sample. We require the reflectance data on a 0 to 1 scale, means no RAW data. Transformation is done automatically by using a white standard. The file header assigns the spectrum to the specific sample of the type Yi,j,k,...,p. The size of the indices are determined by the size of your experiment. The indices should be sorted from outside to inside. The bottom end index should follow the serial number, followed by the repetition and the leaves of one plant or the crop itself. The following labels are most important for the analysis: the labelling continues with the factor levels for a single factor experiment, while the smallest number (0 or 1) is reserved for the control variant. In case of a multifactorial experiment the labels continue with the two or more factors, finally the top line represents the combination of the two factors. The first three lines are used for the analysis, the other rows are used for orientation and identification of the individual signature.
Table zoom
| Combination/class (product of factor 1 x factor 2, ex: i=1 - 6) | 1 | 1 | 1 | ... | 2 | ... | 6 |
| Factor 1 (j=1-3); ex.: variety | 1 | 1 | 1 | ... | 2 | ... | 3 |
| Factor 2 (k=0-1); ex.: 0, non infested control, 1: infested variant. | 0 | 0 | 0 | ... | 0 | ... | 1 |
| Plant/repetition (l=1-6) | 1 | 1 | 1 | ... | 1 | ... | 6 |
| Leaf of plant l (m=1-3) | 1 | 2 | 3 | ... | 3 | ... | 3 |
| Repetition per leaf (1-5) | 1..5 | 1..5 | 1..5 | ... | 1..5 | ... | 5 |
| Sample No. | 1..5 | 6..10 | 11..15 | ... | 21..25 | ... | 540 |
In summary for the given experiment: 5 measurements per leaf were taken, 3 leaves of each plant. 6 plants per variety (factor 1), both for the control and the infected variant (factor 2). The combination of both factor are used for the analysis of the interaction using an combined index of both factors.
To avoid unnecessary work we recommend an initial contact (contact button)

