Examples of hyperspectral signatures of different types of tissue and related
model fitting
In most cases spectral measurements are done on green leaves or canopies. The
green tissue generates a characteristic signature pattern, which varies with the age structure of the plant.
In fact, the two dynamic processes "growth" and "senescence" can mask any other factors. A fully grown, mature leaf does
not change much, we see some kind of upper asymptote in the signature, again, masking potential traits or factors of interest. But the
library also shows the diversity of hyperspectral signatures and gives reasons affecting the signatures. The visual comparison
with model fits demonstrate the flexibility of our analysis method for all available spectra, transfering hyperspectral signals into parameters usable
for statistics and comparisons.
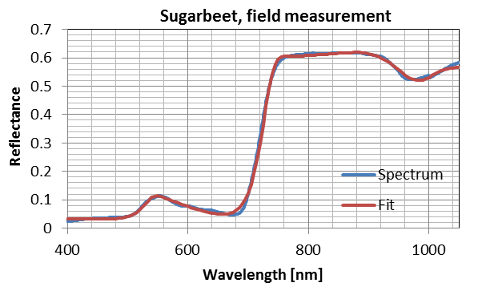
Classical standard spectrum of a mature green leaf with
all characteristics of a sugar beet leaf. (leaf structure, cuticula, leaf
diameter etc.). Example demonstrates the asymptotic boundary of a
healthy, mature crop. Measurement taken above canopy.
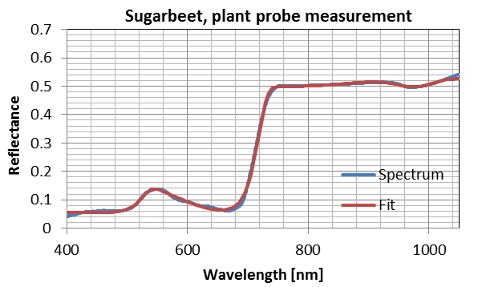
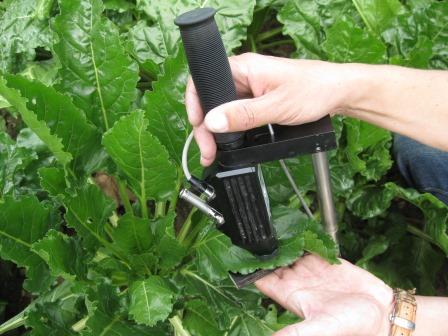
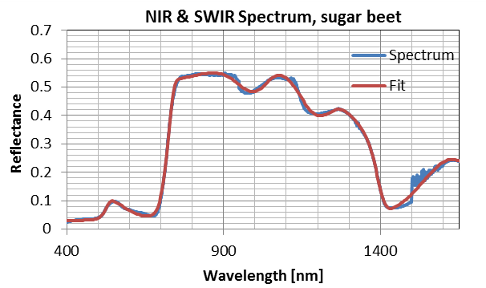
Again, one of the classical results: green, mature
sugar beet leaf, measurement taken with plant probe directly taken from the leaf
surface with own light source and no disturbances in the signal.
Measurements taken with a plant probe were found to result in stable
signals and are most likely to represent some kind of "true" signal of a
tissue. we have constant light conditions and no disturbances in the
reflectance. Data gained on this base allow the statistical analysis
with respect to minor differences in the parameters. We recommend this
method for specific questions in stress responses or trait phenotyping
in greenhouse experiments or simple pot experiments, etc.
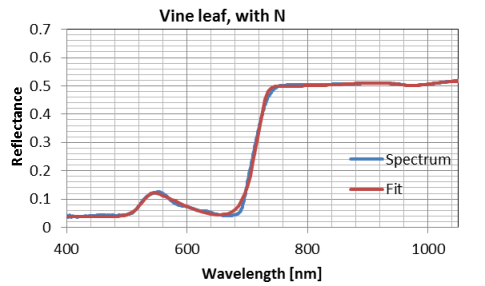
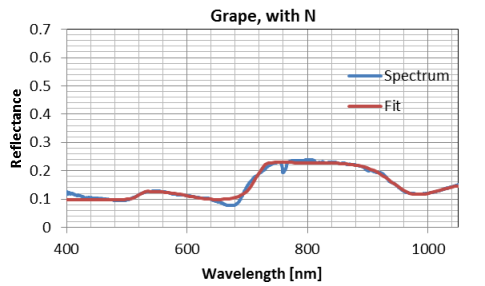
Example of an N fertilised vine leaf of
elder age, but before the beginning of senescence.
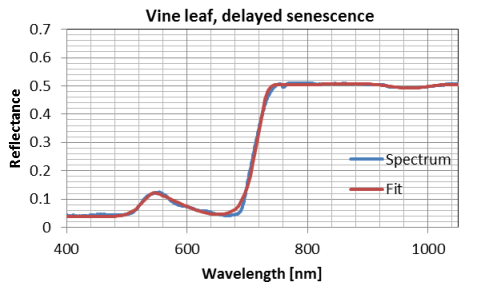
Vine leaf in the beginning of senescence stage and disturbances in
some domains (760nm). Fitting the model adjusts such disturbances without loss of information. That
is of need, as the usual analysis methods might emphasise on that
domain and would find arbitrary differences.
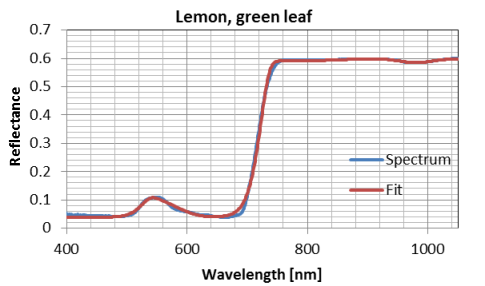
Green leaf with a thick cuticula and waxed leaf surface,
strong light absorption (= low reflection) in the chlorophyll domains.
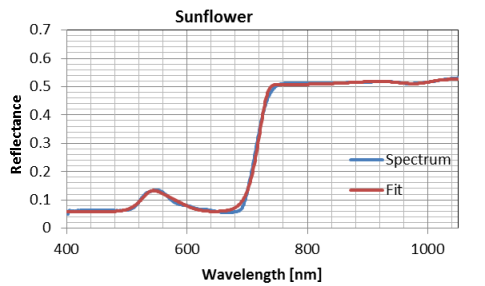
Sunflower leaf, no differences compared to vine leaves
on the spectral scale, soft, hairy leaf.
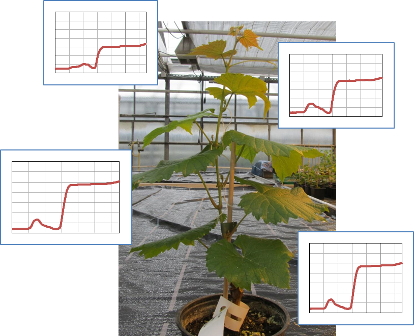
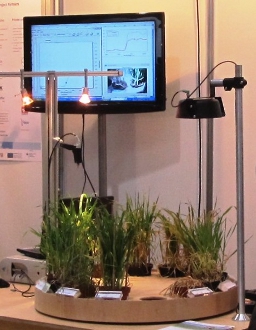
Demonstration
model of a phenotyping facility with immediate spectral analysis (see
background screen). Example of crop measurement, when both plant
morphology and treatment (fertiliser) affect the result and disturb the
hyperspectral reflectance.
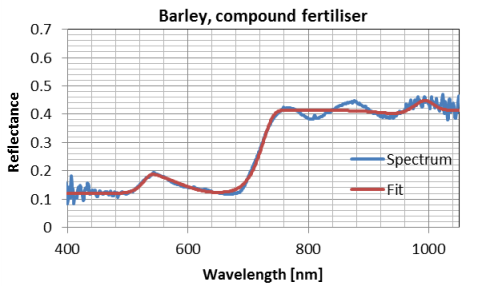
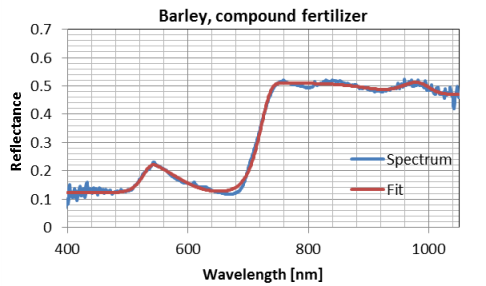
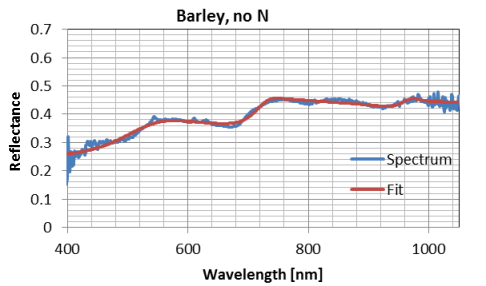
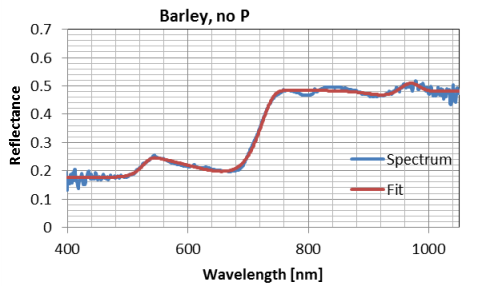
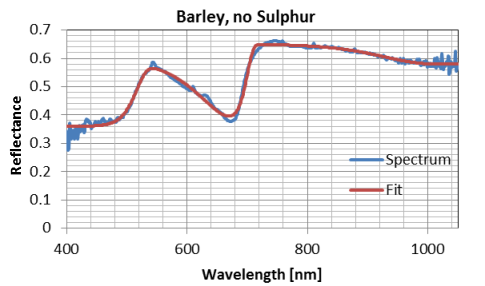
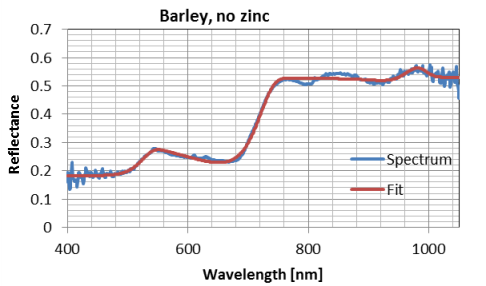
Example: sensing a barley plant in a pot experiment,
reflectance measurement from above. Resulting deviance and and
disturbances are due to the morphology of the plant and imperfect
artificial light conditions, leading to oscillation in the sensor signal. Smoothed
by model fit, treatment: compound fertiliser.
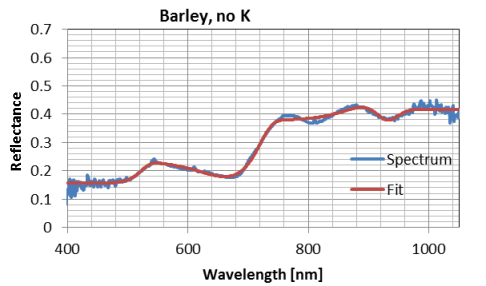
Example as above, treatment no potassium (no K)
Example as above: no nitrogen, poorly developed leaves,
the reflectance of the soil predominates the signal.
Example as above: no phosphor
Example as above: no sulphur.
as above, no zinc
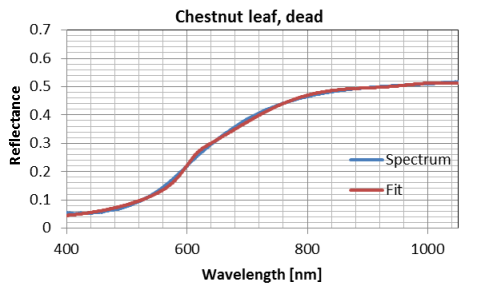
Chestnut leaf, dead, brown tissue, any structure in the
signal is lost.
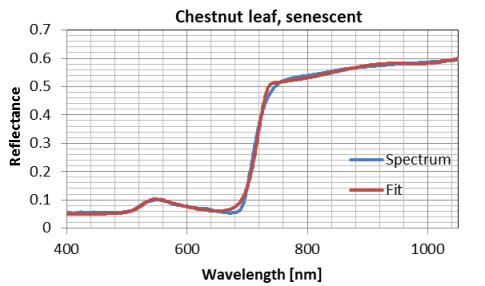
Chestnut leaf at the start of senescence, chlorophyll
partly transferred, necrotic spots on leaf surface.
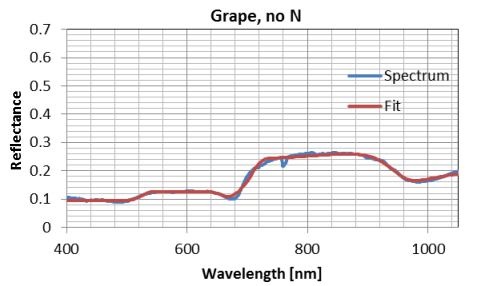
Measurement taken from another organ, grapes at
different stages of maturity with respect to nitrogen supply.
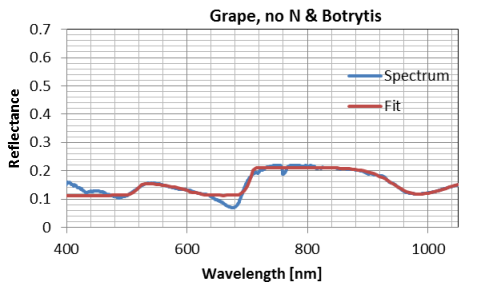
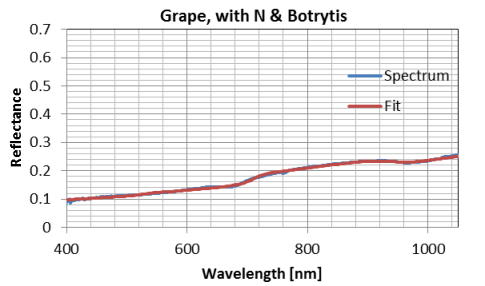
Reflectance of grapes with Botrytis infestation.
Spectrum of grapes with nitrogen supply.
Grapes with advanced botrytis mycel due to higher
nitrogen level. The pathogen has already destroyed the tissue structure of
the grape.
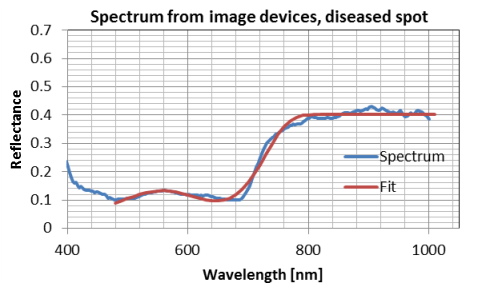
Example of an imaging line scanner. The averaged spectrum
is equal to a non-imaging sensor, but the spectrum of one pixel shows
numerous scatters and disturbances over all domains.
Here is the model fitting of particular importance to smooth the
signature, as analysis methodes might stress the scatter in single
domains instead the true treatment effect.
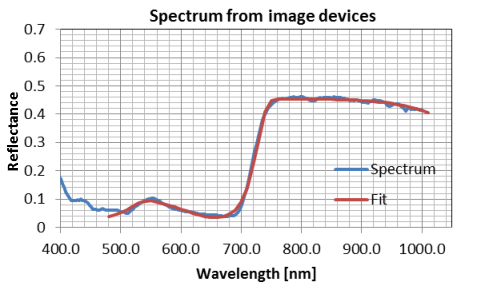
Same object and problem as above, but signature taken
from a pixel representing healthy leaf tissue.
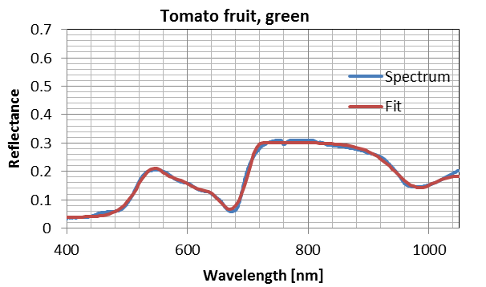
Measurement taken from a green fruit instead of leaves.
Another plant organ with different tissue structure, waxed surface and
high water content. Analysis of such patterns again by model fitting.
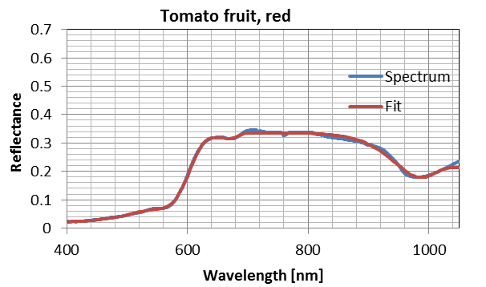
Measurement from a red tomato fruit. The chlorophyll
related domains are changed by the red pigments. Fitting and analysis by
model application.
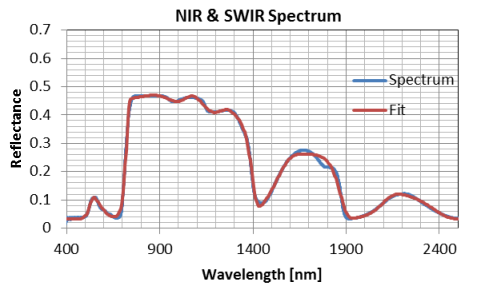
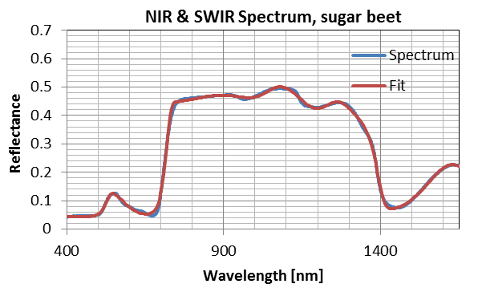
Example for spectra up to 2500nm, measured with
contact probe, means the common perturbations of the water domains are
missing. Model fitting and analysis include information from the SWIR
domains. As the model has much more parameters compared to a fit up to
1050nm, much larger sample sizes are required.
Canopy measurement with light adaption up to 1600nm.
With respect to exposure time we see perturbations and jumps in the
signature plus the problems with the water domains. Model fit smooth
both jumps and perturbations.
As above, but with contact probe, omitting many sources
of error. Model fit up to 1600 nm.
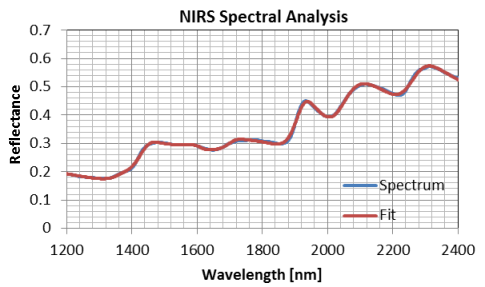
Spectrum of a NIRS spectrometer in the range from 1200
to 2400 nm; used for the estimation of ingredients and substances in prepared samples of any tissue.
Can be used to accelerate analytical processes in the lab
or to replace parts of complex processes by NIRS information.
Establishing sufficient sample size can be used for the calibration of
empirical correlations of spectra to the amount of substances. It does
work for most of components, not only for dry matter or protein contents
or similar.
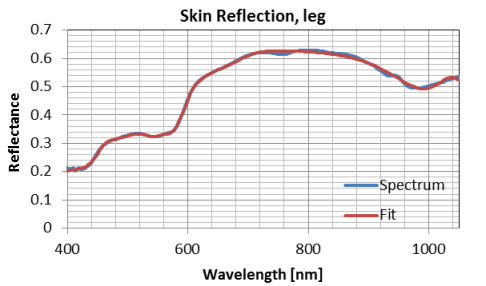
Reflectance of the skin. Spectra vary with numerous
factors as melanin content, skin humidity, fat, age, etc. All those
spectra can be fitted to the Weibull model, classification are possible
with large samples.
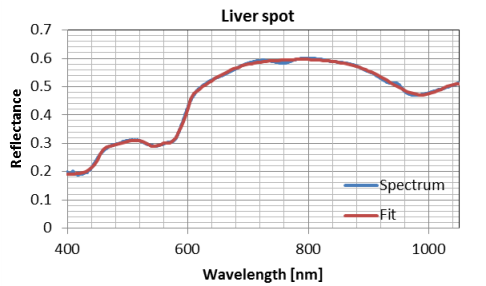
Mean spectra of the skin including a liver spot. The
size of scanned area by the contact probe is too large to give evidence
of some anomaly.
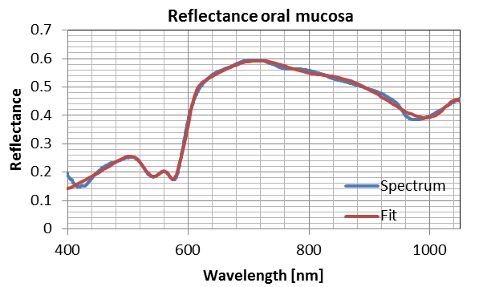
Human tissue (oral mucosa) with high humidity level.
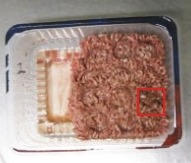
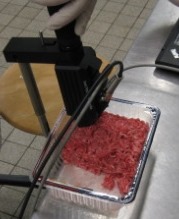
Minced pork meat, decayed, (red square) with obvious colour changes and
high CFU values.
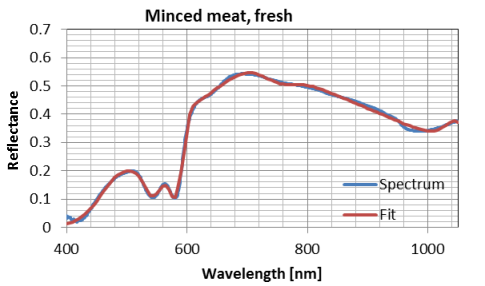
Fresh
minced meat and its characteristic spectrum, red colour might be
increased due to atmospheric packages. Hyperspectral reflectance
measurements can be used for quality management and production control
in slaughterhouses.
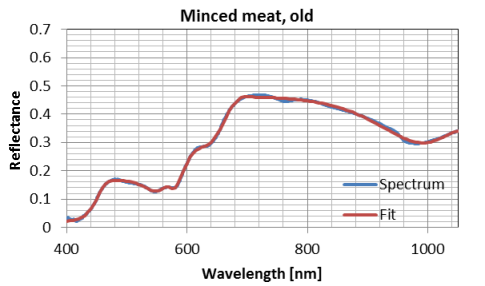
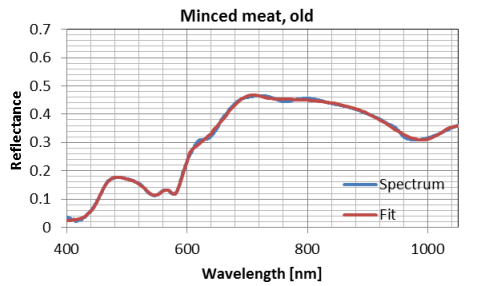
Minced meat stored after one week at 4°C. The meat
has changed visually and also its consistency and the reflectance
signature.
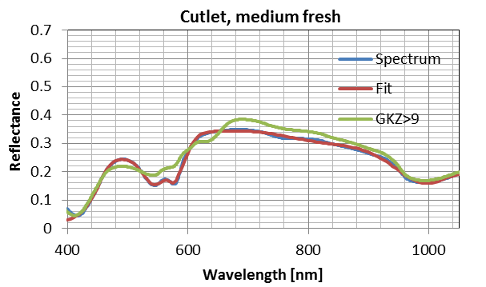
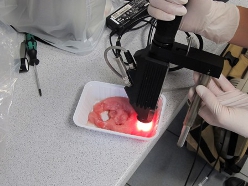
Pork
cutlet signature with contact probe; the sample is visually red, no
oxidation has occurred yet. The CFU values are in the range of (log) 4.
For comparison the spectrum of a decayed cutlet sample is shown in the
graph. The signature represents CFU values >8 to 9.
Nemaplot uses cookies to provide its services. By continuing to browse the site you are agreeing to our use of cookies.
More information (in German only)
 Again, one of the classical results: green, mature
sugar beet leaf, measurement taken with plant probe directly taken from the leaf
surface with own light source and no disturbances in the signal.
Measurements taken with a plant probe were found to result in stable
signals and are most likely to represent some kind of "true" signal of a
tissue. we have constant light conditions and no disturbances in the
reflectance. Data gained on this base allow the statistical analysis
with respect to minor differences in the parameters. We recommend this
method for specific questions in stress responses or trait phenotyping
in greenhouse experiments or simple pot experiments, etc.
Again, one of the classical results: green, mature
sugar beet leaf, measurement taken with plant probe directly taken from the leaf
surface with own light source and no disturbances in the signal.
Measurements taken with a plant probe were found to result in stable
signals and are most likely to represent some kind of "true" signal of a
tissue. we have constant light conditions and no disturbances in the
reflectance. Data gained on this base allow the statistical analysis
with respect to minor differences in the parameters. We recommend this
method for specific questions in stress responses or trait phenotyping
in greenhouse experiments or simple pot experiments, etc.
 Sunflower leaf, no differences compared to vine leaves
on the spectral scale, soft, hairy leaf.
Sunflower leaf, no differences compared to vine leaves
on the spectral scale, soft, hairy leaf.
 Demonstration
model of a phenotyping facility with immediate spectral analysis (see
background screen). Example of crop measurement, when both plant
morphology and treatment (fertiliser) affect the result and disturb the
hyperspectral reflectance.
Demonstration
model of a phenotyping facility with immediate spectral analysis (see
background screen). Example of crop measurement, when both plant
morphology and treatment (fertiliser) affect the result and disturb the
hyperspectral reflectance.
 Minced pork meat, decayed, (red square) with obvious colour changes and
high CFU values.
Minced pork meat, decayed, (red square) with obvious colour changes and
high CFU values.
 Fresh
minced meat and its characteristic spectrum, red colour might be
increased due to atmospheric packages. Hyperspectral reflectance
measurements can be used for quality management and production control
in slaughterhouses.
Fresh
minced meat and its characteristic spectrum, red colour might be
increased due to atmospheric packages. Hyperspectral reflectance
measurements can be used for quality management and production control
in slaughterhouses.
 Pork
cutlet signature with contact probe; the sample is visually red, no
oxidation has occurred yet. The CFU values are in the range of (log) 4.
For comparison the spectrum of a decayed cutlet sample is shown in the
graph. The signature represents CFU values >8 to 9.
Pork
cutlet signature with contact probe; the sample is visually red, no
oxidation has occurred yet. The CFU values are in the range of (log) 4.
For comparison the spectrum of a decayed cutlet sample is shown in the
graph. The signature represents CFU values >8 to 9.
 Back to Measurements
Continue to Medians & quantile
Back to Measurements
Continue to Medians & quantile
