Time series experiments
One more advantage of the measurements of optical properties are, beside the fast data assessing and non-destructive procedures, the endless possibility of repetitions on the same object. An experiment can be monitored in daily intervals, the relative changes of a treatment is recorded in terms of their hyperspectral signals. It offers the opportunity to highlight complex relations, their dynamics and in time controlling by work extensive and low budget trials. Using spectrometer devices enables the detection of the dynamics of complex impact factors by relatively simple and small experiments. Choosing a moderate salt stress in rice as an example, we demonstrate the response dynamics of the plant based on the spectra and the related statistical parameters. The plants were watered daily with a low concentration of salty water, so the salt concentration accumulated slowly in the pots. Due to the non-destructive measurements the development of the stress and the response of the plants can be closely monitored (and managed) as time progresses.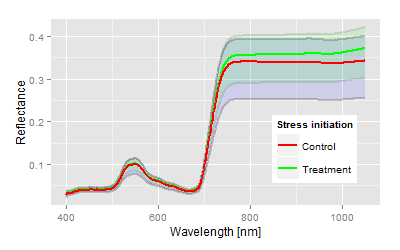
How do the dynamics of the experiment behave on the parameter end? Measurements have been started 2 days after stress initiation (DAI). The dynamics of the salt stress effect can be taken from the canonical distances:
More detailed explanation about the dynamics of the statistical parameter
and conclusions are provided in the following Link ... more

Summary
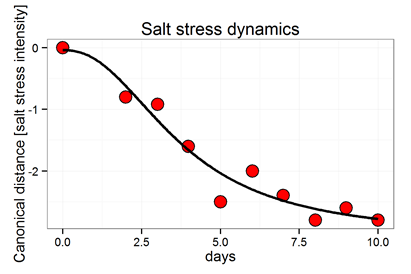
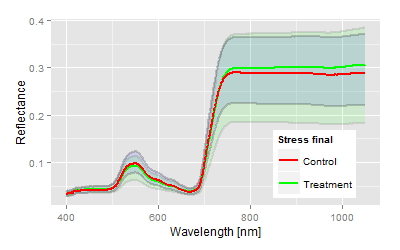
The induced salt stress was explicitly detected based on hyperspectral reflectance data. But as the ANOVA table shows: the distinction is based solely on one parameter: AC2. This parameter describes the point of inflection from visual light to infrared and relates to the common used "REIP" Index (Red Edge Inflection Point). The size of the F-value shows, how massive the salt stress affects the leaf in the mean time, but just in this domain. All other parameter are not significant, despite the mean signatures might differ in some domains visually but not in reality or statistical terms. The stress is first detectable after 5 to 7 days. The canonical distance is significant, but not that distinctive as the other statistical parameters. The weaker performance may be caused by an additional problem: the leaf diameter of a young rice plant is smaller than the optical area of the plant probe, which increases the likelihood of errors and results in a larger variance. The dynamics of the parameters mirror the dynamics of the stress: after stress onset and a lag phase of the plant we see an exponential response to the stress, an upper asymptote is imaginable, a logistic growth model can be derived from the secondary statistical parameter. It should be clear: the kind of stress cannot be defined, only the difference between a treatment and control is detectable. The kind of stress is given by the experimental design. Inducing other stresses, as drought or ozone, leads to similar distribution of spectra, similar dynamics and similar statistical parameters.
