Modeling dynamical processes with differential equations (ODE's) and parameter fitting
by using the
Excel® Solver
Quality check
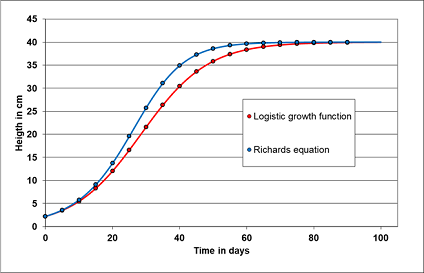
To check the precision of the numerical integration of the ODE's, the outcome of the analytical solution with a given set of parameters (see table 1) of widely used differential equations, as the logistic growth function and the Richards function, are contrasted to the numerical solutions of the RKF method of both differential equations (fig. 1). The maximum deviance is in the range 1E-8.


The related VBA code:
dy(1) = r * y(1) * (1 - y(1) / K)
dy(2) = r * y(2) * (1 - (y(2) / K) ^ gamma)
The second check is the accuracy of the estimated parameters for both the analytical and numerical solution of both ODE's.
Table 1: Parameter comparison of fitted ODE-models to first the analytical models and second to numerical solved models
| Parameter | True parameter | Fit to analytical model | Fit to numerical model |
|---|---|---|---|
| y0 | 2.2 | 2.20004 | 2.20030 |
| r | 0.1 | 0.10002 | 0.09999 |
| K | 40 | 39.99996 | 40.00018 |
| γ | 1.4 | 1.40001 | 1.40004 |
The results show minor deviance from the exact target value, while the fit to the numerical solution appears marginal poorer compared to the fit to the analytical solution of both models. It is up to the user whether such uncertainties of the fitting process are acceptable for his needed precision.

 Evaluation reinvented
