Analysis of an one-factorial experiment with n factor level
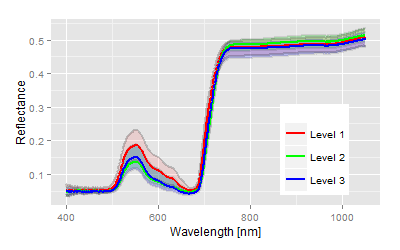
We use the reflectance spectra of a one-factorial trial as an example. The treatment factor is discrete, three factor levels or traits have been set up.
Question: Are there differences between the three factor levels? If yes, which traits are different to which relation and ranges?
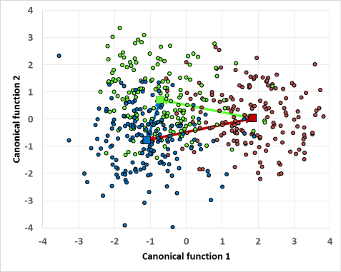
| Statistical parameter | Explanation: Analysing factor levels of the size n require n-1 discriminant functions for the test. The canonical correlation is partitioned similar with respect to explained variance. The resulting scores (values of the discriminant functions) are depicted as coordinates in the canonical 2D/3D system, even if coordinates of higher order are gained. It depends on the complexity of the experimental design. | |
| Wilks-Lamda | p=0.000 | Discriminant functions are significant, means a highly significant difference between the three traits. |
| Canonical correlation | 0.79 und 0.53 | The correlation is high for the first discriminant function on a scale from 0 to 1, again, the difference is obvious. The second discriminant function shows a lower correlation, but accounts for 20% of the explained variance only. |
| Canonical distances | 2.74 | The canonical distances provides n possible comparisons: For given design we get a distance from level 1 to level 2 of 2.7(***), from level 1 to level 3 a value of 3.1 (***) and from level 2 to level 3 a value of 1.5 (n.s.) on the scale of the canonical area. Trait 1 is significant different from trait 2 and 3 the expression between trait 2 and 3 with a value of 1.5 is much weaker and not significant. |
| Classification | 82% | High, the discrimination between the three traits is relatively high. |
ANOVA table for given spectra
| Parameter | A | B1 | AC1 | BC1 | AL1 | BE1 | B2 | AC2 | BC2 | AL2 | BE2 | B3 | AC3 | AL3 |
| F-value | 26.9 | 17.5 | 54.5 | 46.1 | 8.6 | 5.1 | 0.6 | 60.3 | 42.8 | 3.9 | 55.4 | 29.4 | 24.4 | 62.6 |
| p-value | 0.000 | 0.000 | 0.000 | 0.000 | 0.000 | 0.006 | 0.554 | 0.000 | 0.000 | 0.021 | 0.000 | 0.000 | 0.000 | 0.000 |
Summary
The three discrete traits of this experiment can be discriminated well on data from a hyperspectral base, the statistical parameters provide a clear picture of the situation. The ANOVA F and p-values demonstrate the difference of the spectra in most of the hyperspectral domains with high significances. But the system provide more valuable information. Which spectra differ to which degree demonstrate the distances on the canonical area. The distances of the trait centroids result in a relative number, which quantifies the differences of the traits on this dimensionless scale. Taking into account an advanced significance level we can assume, there is no difference between level 2 and 3, but from 1 to 2 and 3. This advanced test is certainly questionable and the interpretation might be limited, but lowering the significance level from 0.05 to less than 0.001 for example, provides a most interesting equivalence to the mean comparison tests of the classical analysis.

